InvestmentTools.com | home 
About Equities Commodity/Futures The State Notes/Bonds Editorials Com$tock Letter Links The Fed & Short Sales Real Estate Miscellaneous
Horses eat them -
Horses-asses trade
them.
Trader of Oats
|
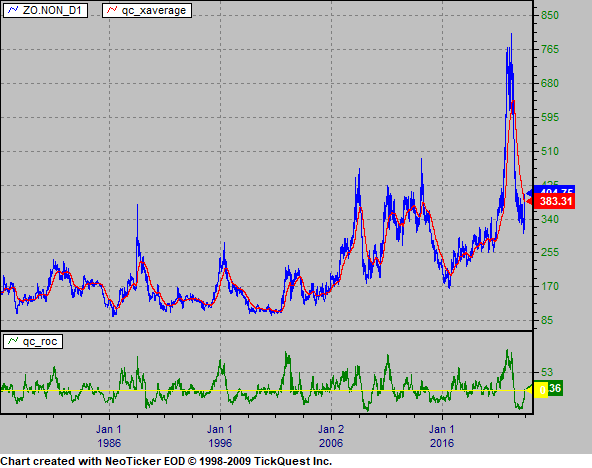
Oat Futures
Oats from 1975 xaverage in red,and 200 day ROC
(rate of change) in green.
|
|

|
|
Oat Futures - The Blue line is a Donchian channel, red line is a 5 day exponential average, green line is a 20 day exponential average. Vertical green bars MACD (Moving average convergence divergence) 5 and 20.
|
|

|
|
Oats recent
|
|

|
|


____________________________________________________
of cheerios (Farmfood360.ca)
As of 2021 the cost of 1 box of cheerios is about $3.49
Take a lower $3 x 43 = $129
Taking a high $10 per bushel of oats the oat input cost would be around 8%
______________________________________
Oats 3.176 million (the lowest on record)
|