InvestmentTools.com | home          
Buy when others are despondently selling and sell when others are greedily buying.
Mark Mobius


US Treasury Bond


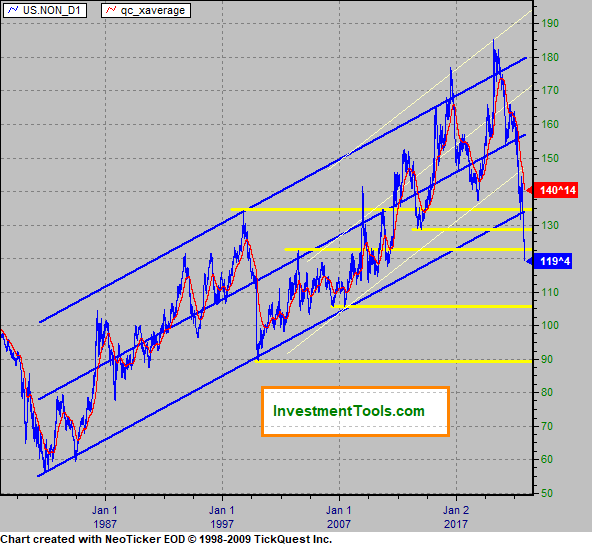
T-Bonds (Futures) from 1978 and 200 day exponential average (red).
 
T-Bond Futures - The Blue line is a Donchian channel, red line is a 5 day exponential average, green line is a 20 day exponential average. Vertical green bars MACD (Moving average convergence divergence) 5 and 20.
 
US Treasury Bonds (spot) Point & Figure (Box= 8/32 reversal = 2)
 
Notes & Links
 

4/11/11 Two of the Fed's most powerful officials said the U.S. central bank should stick to its super-easy monetary policy, arguing inflation is not a threat and unemployment remains too high.
The Fed needs to keep an easy monetary policy in place while the government comes to grip with its debts, the IMF said.
PIMCO, the world's largest bond fund, has shifted to a short position in U.S. bonds
2/10/06 FT Bonds “on steroids” after long bond sale “Stellar” and “stunning” were also applied as the market digested the strong demand for Thursday’s sales of 30-year long bonds – the first in more than four years.
11/02/05 The U.S. government announced that it will begin selling the 30 year Treasury bond again on February 9, 2006.
08/03/05 The US Treasury said early Wednesday that it will bring back the 30-year bond with an auction in the first quarter of 2006, with auctions held twice a year. The Treasury didn't say exactly how much in 30-year bonds it plans to sell next year, although it's estimated the size per year will be about $20 billion to $30 billion.