InvestmentTools.com | home 
About Equities Commodity/Futures The State Notes/Bonds Editorials Com$tock Letter Links The Fed & Short Sales Real Estate Miscellaneous
If Stupidity got us into this mess, then why can't it get us out?
Will Rogers (1879-1935)
|
DJIA Dow Jones Industrial Average
 |
 |
 |
 |
 |
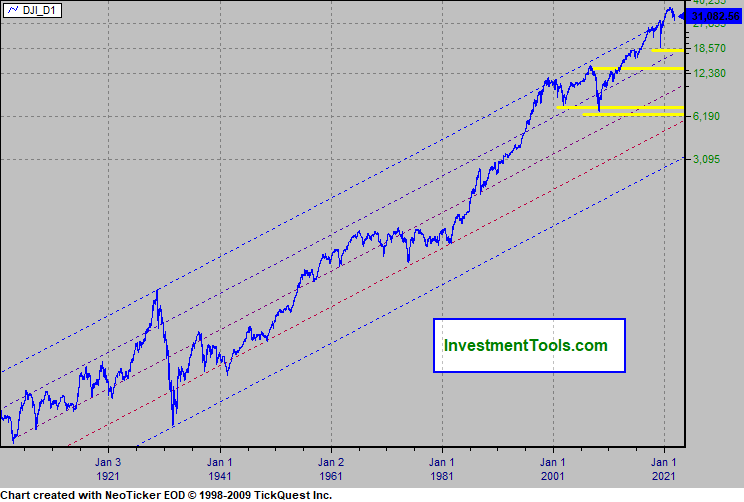
Dow Jones Industrial Average
(long term log chart).
|
||
|
||
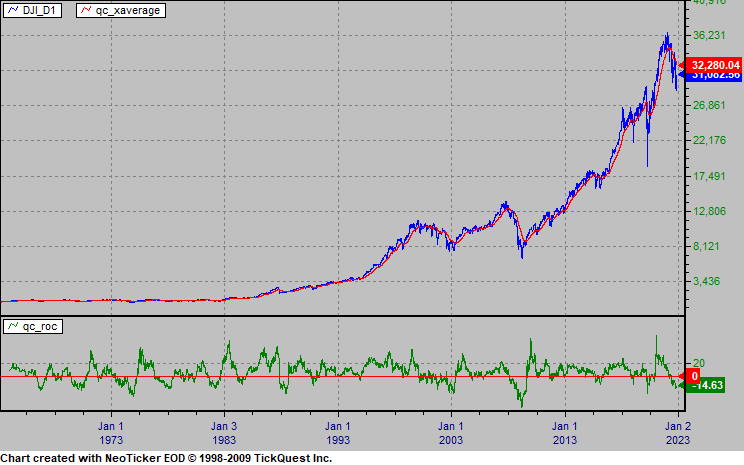
DJIA (arithmetic chart), 200 day exponential
average (red), 200 day rate of change (green).
|
||
|
||
Dow Jones Industrial Average adjusted by the CPI
(Consumer Price Index)
|
||

|
||
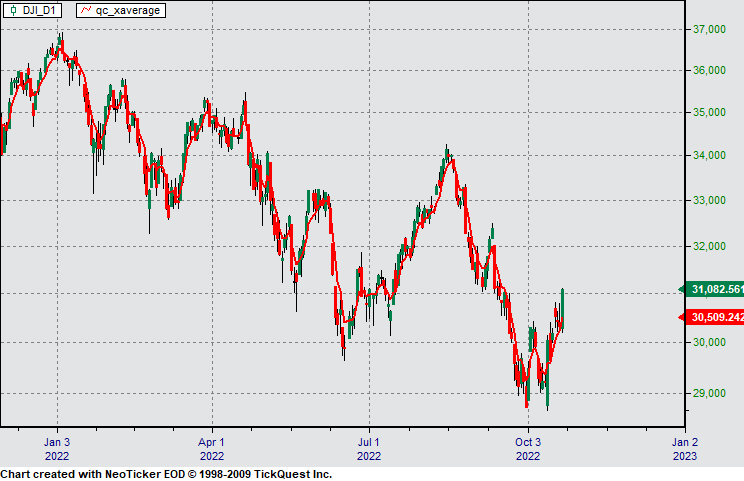
DJIA Recent.
|
||
|
||
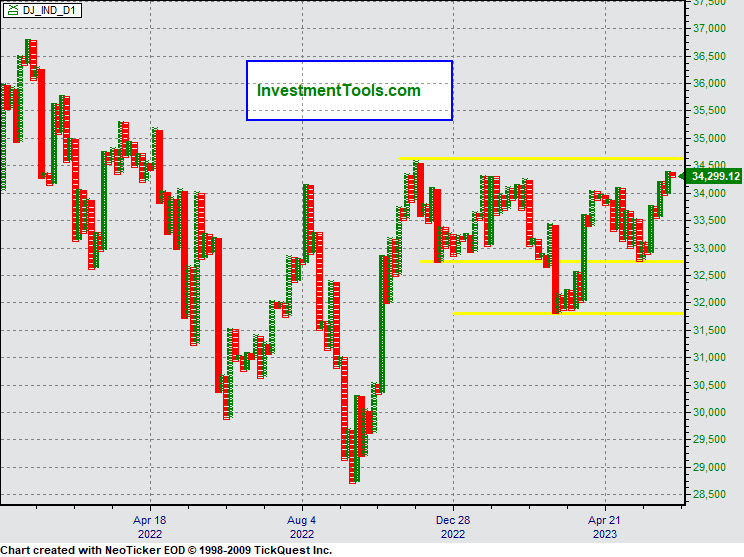
DJIA Point & Figure Chart (Index) Box = 30 Reversal = 3
|
||
|
||
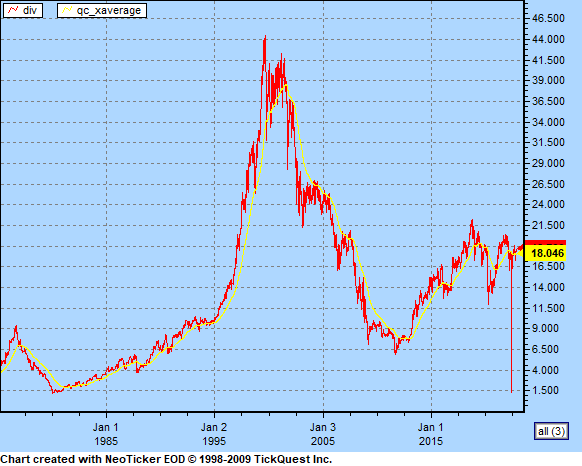
Dow / Gold Ratio (DJIA divided by Gold $ per oz price)
400 day xaverage yellow.
|
||
|
||
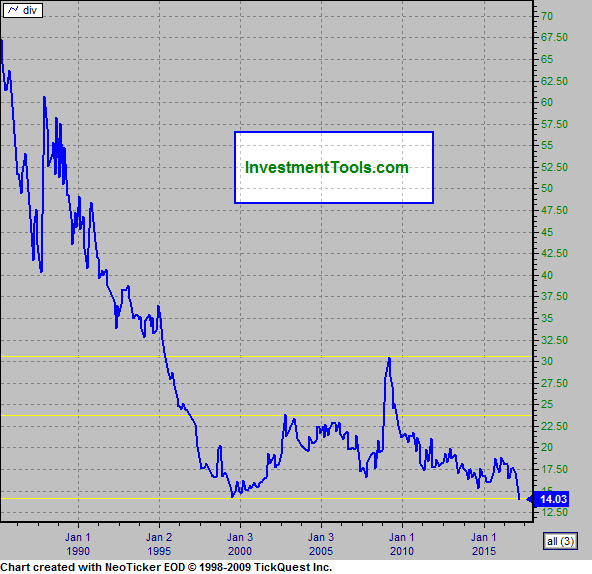
How many shares of the Dow Jones Industrial Average does it take to buy the Average U.S. House?
Average U.S. real estate price divided by Dow Industrial
|
||
|
||
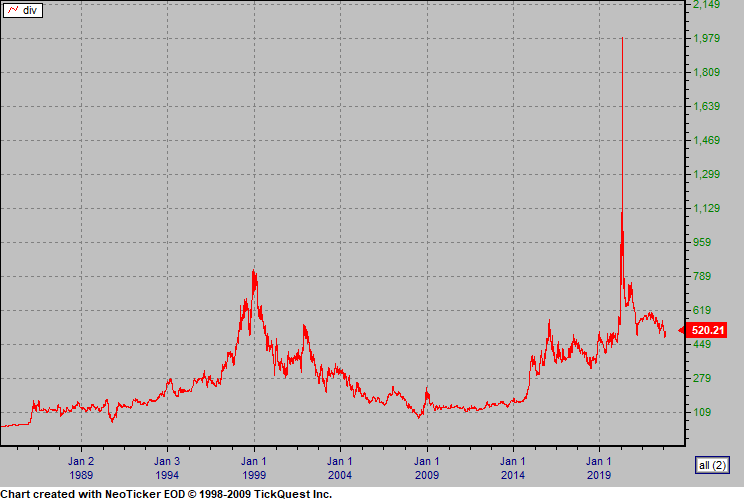
Dow / Crude Oil Ratio
|
||
|
||
The average dividend yield over the whole period was 4.87 percent. Ignoring this return leads to enormous understatements of the long run
payoff to owning stocks. It would not be difficult to publicize a total return index rather than a stock price index. On a daily basis, the difference would be barely noticeable. However, over time horizons longer than three months, the difference becomes noticeable. Over decades, the difference becomes enormous.
A value-weighted index of the Dow-components including dividend payments (VW-DOWD) would have closed at 233,060 points at the end of December 1998 had it started off in October 1928 at 239.43 points.
|