InvestmentTools.com | home 
About Equities Commodity/Futures The State Notes/Bonds Editorials Com$tock Letter Links The Fed & Short Sales Real Estate Miscellaneous
The emotions of man are stirred more quickly than his intelligence.
Oscar Wilde
|
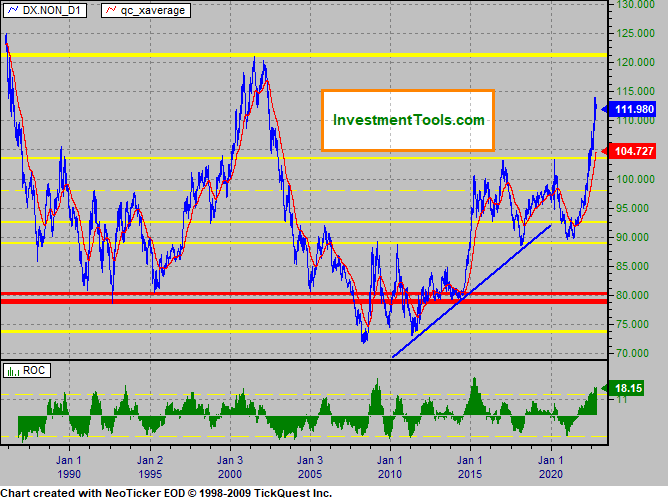
US Dollar Index
US Dollar Index from 1986, and 200 day exponential average in red, 200 day rate of change (ROC) green.
|
|

|
|
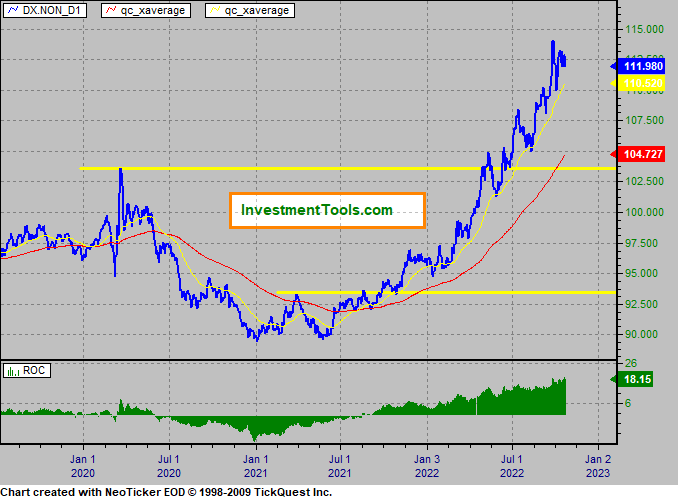
US Dollar Index Recent
|
|

|
|
US $ Futures - The Blue line is a Donchian channel, red line is a 5 day exponential average, green line is a 20 day exponential average. Vertical green bars MACD (Moving average convergence divergence) 5 and 20.
|
|

|
|
US Dollar Index (Spot) Point & Figure Box=0.25 Rev=3
|
|

|
|