InvestmentTools.com   |     home
Taiwan Current account balance as  % of GDP
2001  +1.4
2002  +2.9
2003  +3.0


2007  +5.9
2008  +5.8
2009  +9.6
2010
2011
2012  +8.6
2013  +11.3
2014
2015
2016  +12.9
2017
2018
2019
2020  +11.9


Taiwan Weighted                     Back to List of Indices


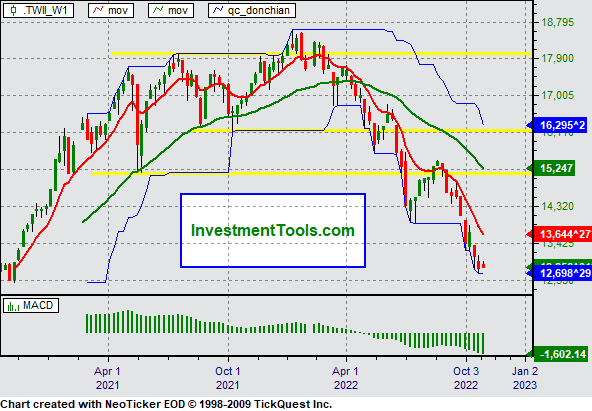
Taiwan Weighted Index (weekly), 20 week exponential average in green, 5 week exponential average in red, MACD (moving average convergence divergence) in green.
 
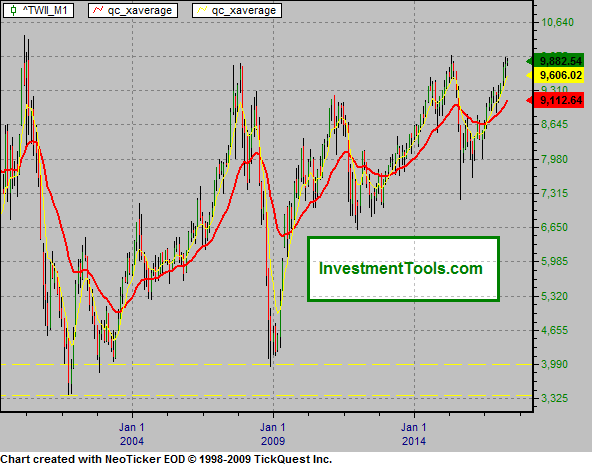
Taiwan Weighted Index monthly chart, the red line is a 24 month exaverage, the yellow line is a 6 month exaverage.
This chart is no longer updated but will remain for reference.
 
Taiwan Notes & Links:
 

5/21/09 YoY Taiwan’s GDP fell 10.2% in Q1.
5/25/06 Taiwan GDP was up 4.2% YoY.
12/28/06 Taiwan's central bank raised its benchmark interest rate by one-eighth percentage point to 2.75%.
6/21/06 Taiwan’s unemployment rate improved from 3.92% to 3.87% in March.
05/19/05 Taiwan's economy grew an unexpectedly weak 2.5 percent YoY.
11/20/04 Taiwan's GDP was up 5.3% in the third quarter year over year, down from a 7.9% increase in the second quarter.
10/29/04 Taiwan's gross domestic product may grow as much as 6 percent this year, more than the government forecast, and inflation below 4 percent- Minister of Economic Affairs Ho Mei-yueh said.