InvestmentTools.com | home
Sri Lanka Current account balance as % of GDP
2009
2010
2011
2012
2013
2014
2015
2016
2017
2018
2019
2020 -2.2
|
Sri Lanka All Shares Back to List of Indices
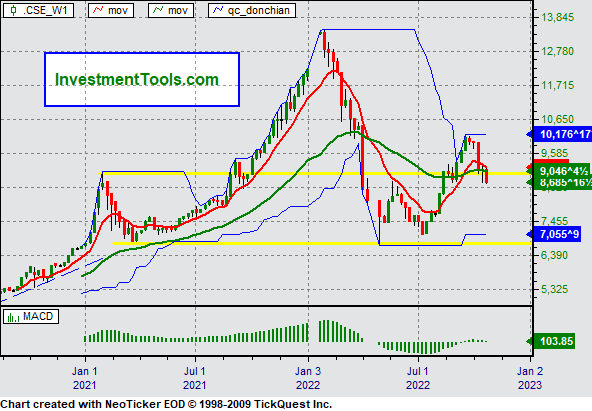
Sri Lanka All Shares Index (weekly), 20 week exponential average in green, 5 week exponential average in red, MACD (moving average convergence divergence) in green.
|
|

|
|
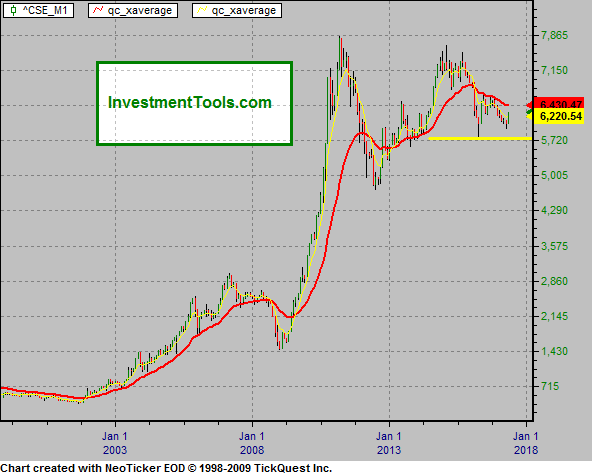
Sri Lanka All Shares Index monthly chart, the red line is a 24 month exaverage, the yellow line is a 6 month exaverage.
This chart is no longer updated but will remain for reference.
|
|

|
|