InvestmentTools.com | home
Malaysia Current account balance as % of GDP
2001 +4.9
2002 +15.9
2003 +9.4
2007 +12.0
2008 +12.8
2009 +14.8
2010
2011
2012 +6.8
2013 +5.3
2014
2015
2016 +1.9
2017
2018
2019
2020 +2.1
|
Malaysia KLSE Composite Back to List of Indices
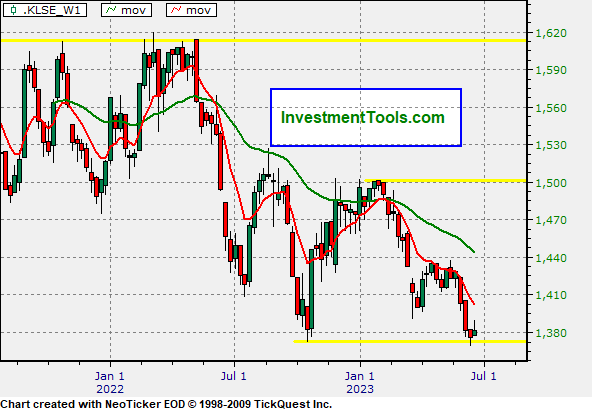
Malaysia KLSE Composite Index (weekly), 20 week exponential average in green, 5 week exponential average in red, MACD (moving average convergence divergence) in green.
|
|

|
|
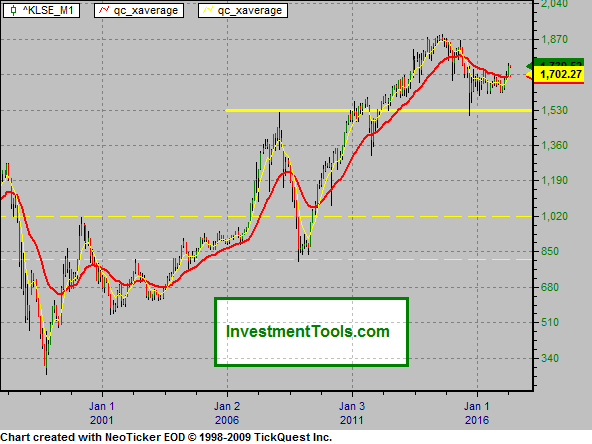
Malaysia KLSE Composite Index monthly chart, the red line is a 24 month exaverage, the yellow line is a 6 month exaverage.
This chart is no longer updated but will remain for reference.
|
|

|
|