InvestmentTools.com | home 
About Equities Commodity/Futures The State Notes/Bonds Editorials Com$tock Letter Links The Fed & Short Sales Real Estate Miscellaneous
"For want of a nail, the shoe was lost;
For want of a shoe, the horse was lost;
For want of a horse, the rider was lost;
For want of a rider, the battle was lost;
For want of a battle, the kingdom was lost!"
|
VIX Volatility Index
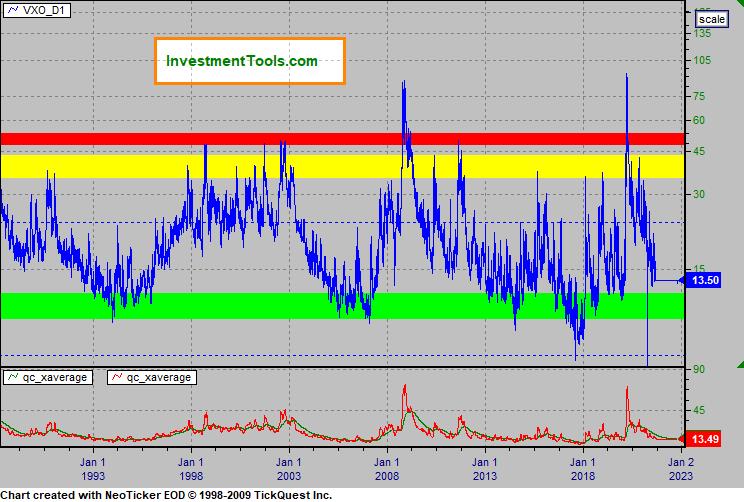
Volatility Index VIX from 1986 (logarithmic chart) with 10 day (red) and 200 day (green) exponential moving average.
|
|

|
|
VIX (recent) with 10 day (red) and 200 day (green) exponential moving average
|
|

|
|
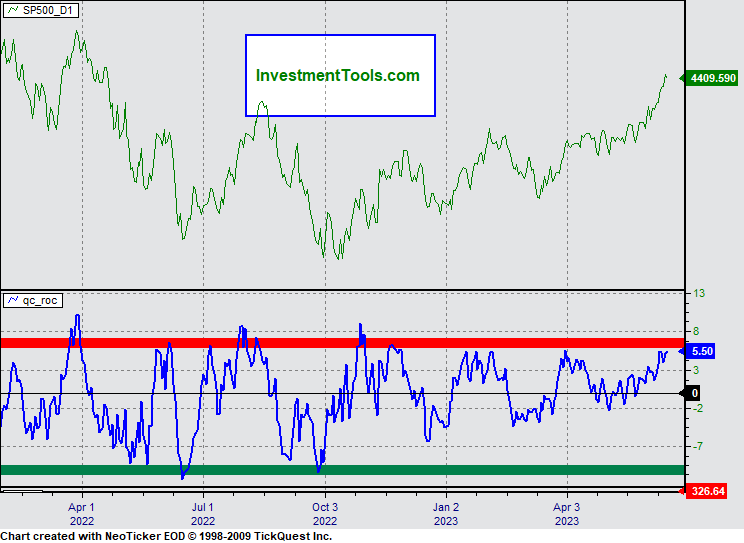
S&P 500 Vix Ratio ROC (Rate of change blue)
|
|

|
|
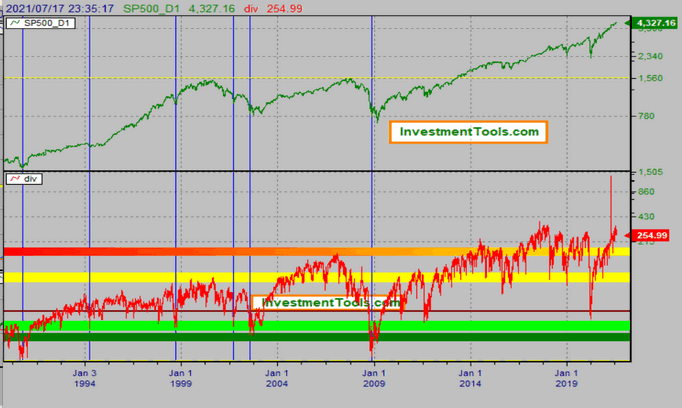
S&P 500 divided by Vix (Volatility Index) Ratio,S&P 500 (Log chart) green, Ratio red, long term chart.
|
|

|
|
Vix, what is it?
|
|
The VIX takes the weighted average of implied volatility for the Standard and Poor's 100 Index (OEX calls and puts) and measures the volatility of the market. A low VIX indicates trader confidence. A high Vix the opposite. Dividing the S&P 500 by the Vix (ratio) gives the confidence level in relation to the market. The higher the ratio the higher the confidence. As always, when sentiments go to extremes, it could be time to pay attention.
|