InvestmentTools.com | home 
About Equities Commodity/Futures The State Notes/Bonds Editorials Com$tock Letter Links The Fed & Short Sales Real Estate Miscellaneous
It has been said the stock market is the only market where customers take flight when there is a sale, only to charge back when they can pay full price.
|
DJTA Dow Jones Transportation Average
(supposedly one of Warren Buffet's favorite indicators)
|
||||||
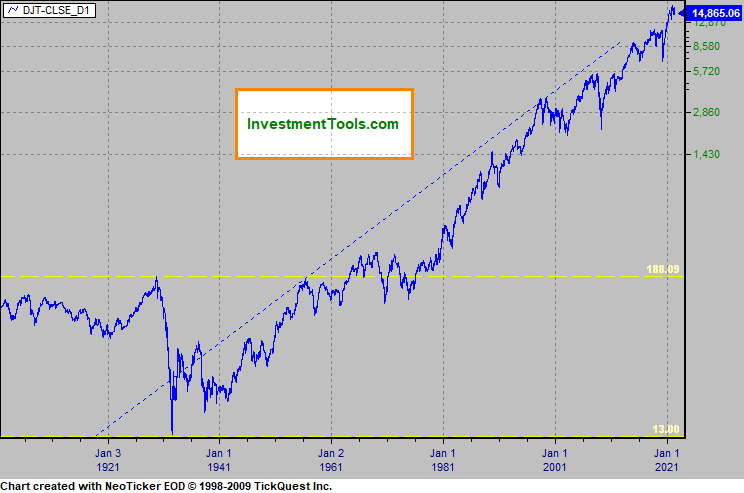
DJT Log Chart from 1901
|
|

|
|
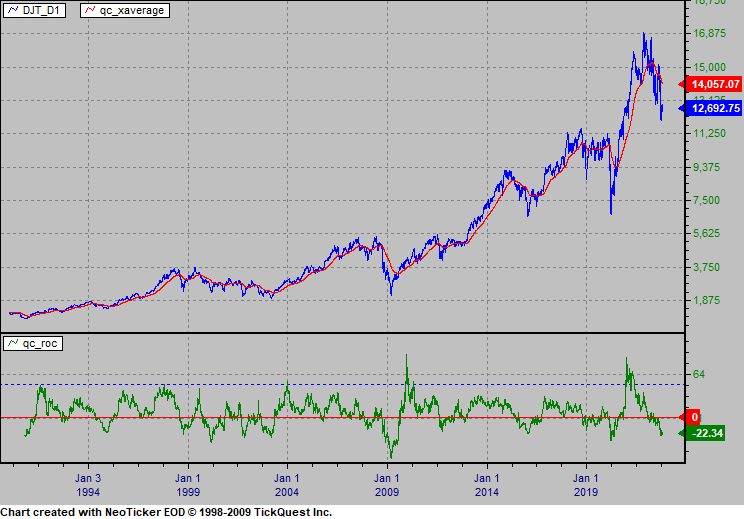
DJT and 200 day exponential average (red), 200 day rate of change (green)
|
|

|
|
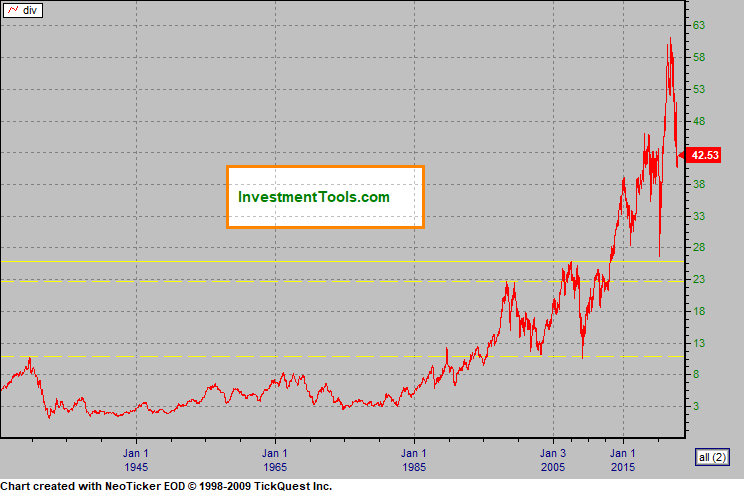
Dow Jones Transport adjusted by the CPI (Consumer Price Index)
|
|

|
|
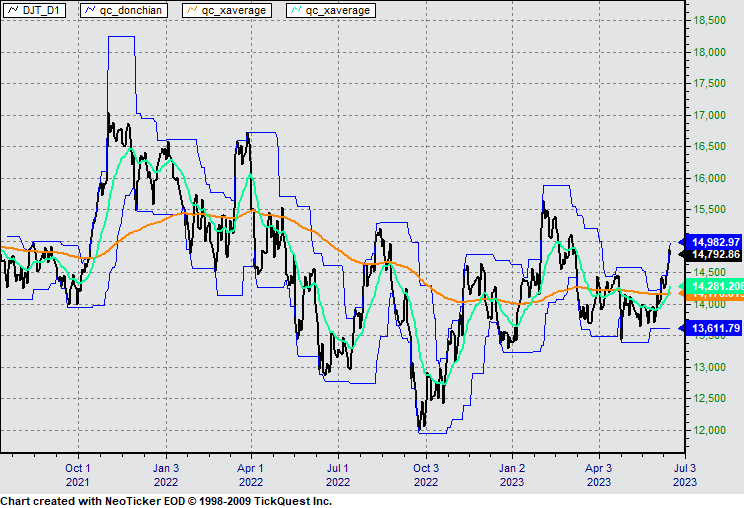
DJIT (recent) The blue line is a 20 day Donchian channel, green line is a 20 day exponential average, yellow line is a 200 day exponential average.
|
|

|
|
U.S. Rail Freight Traffic (supposedly one of Warren Buffet's favorite indicators)
|
|
Rail Freight Carloads
|
|
Rail Freight Intermodal Traffic
|
|
Total Vehicle Sales
|
|