Charts not only tell what was, they tell what is, and a trend from was to is, projected into the will be, contains better percentages than guessing.
R.A. Levy
|
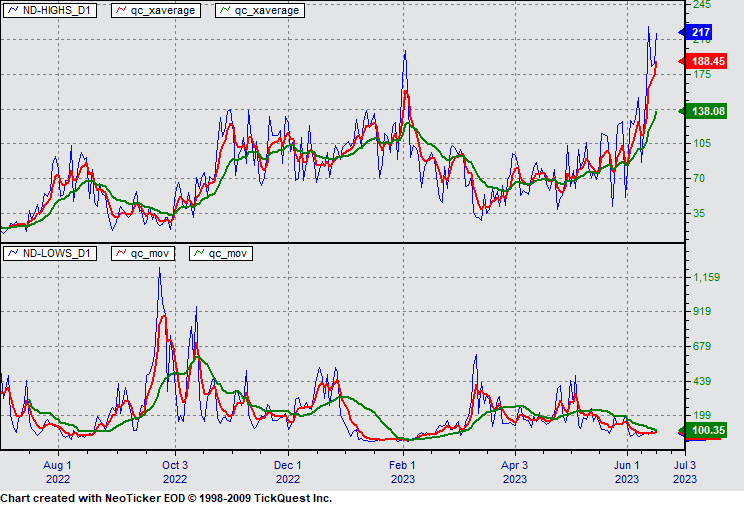
NASDAQ New Highs & New Lows
New Highs NASDAQ / New Lows NASDAQ (below)
five day exponential average (red) twenty day exp.avg.(green)
|
|
|